Water Balance in the Holland Marsh [2004-2014]
This project was completed by Josh Valenti and Ryan Roque for our GIS: Geospatial Management Thesis Project during our time at Niagara College. This project was completed for the Drainage Investment Group (DIG), under the supervision of Mr. Ian Smith. The purpose of this project was to compute a Water Balance of the Holland Marsh from 2005-2014 within a GIS environment. This was done in three phases, a Proposal Report, Progress Report, and a Final Report completed in June, 2015.
Introduction
The Marsh was drained in the early 1920’s strictly for agricultural use. This process consisted of the building of the canal that travels along the north and the south borders of the marsh, allowing for the Holland River to flow through the heart, draining north into Cook’s Bay of Lake Simcoe. Over the last decade, the Holland Marsh has experienced drainage issues, causing valuable land to flood and as a result, destroying crops. Along with flooding, soil erosion has become a primary concern, as the water flow has become a key factor in depleting the land available for agricultural production (Planscape Inc. , 2009).
To mitigate against events destructive to the land, a water balance was calculated for the previous decade (2004 to 2014) using geographic information systems (GIS). A water balance is an analysis over an area comparing the amount of incoming (precipitation) and outgoing (evapotranspiration) water flow of a system. A surplus of water has been occurring recently within the marsh, causing fields to be completely submerged under water. A surplus occurs when the amount of incoming water (precipitation, inflows from surface and groundwater) exceeds that of the storage capacity and the output of a system.
 Map of Study Area
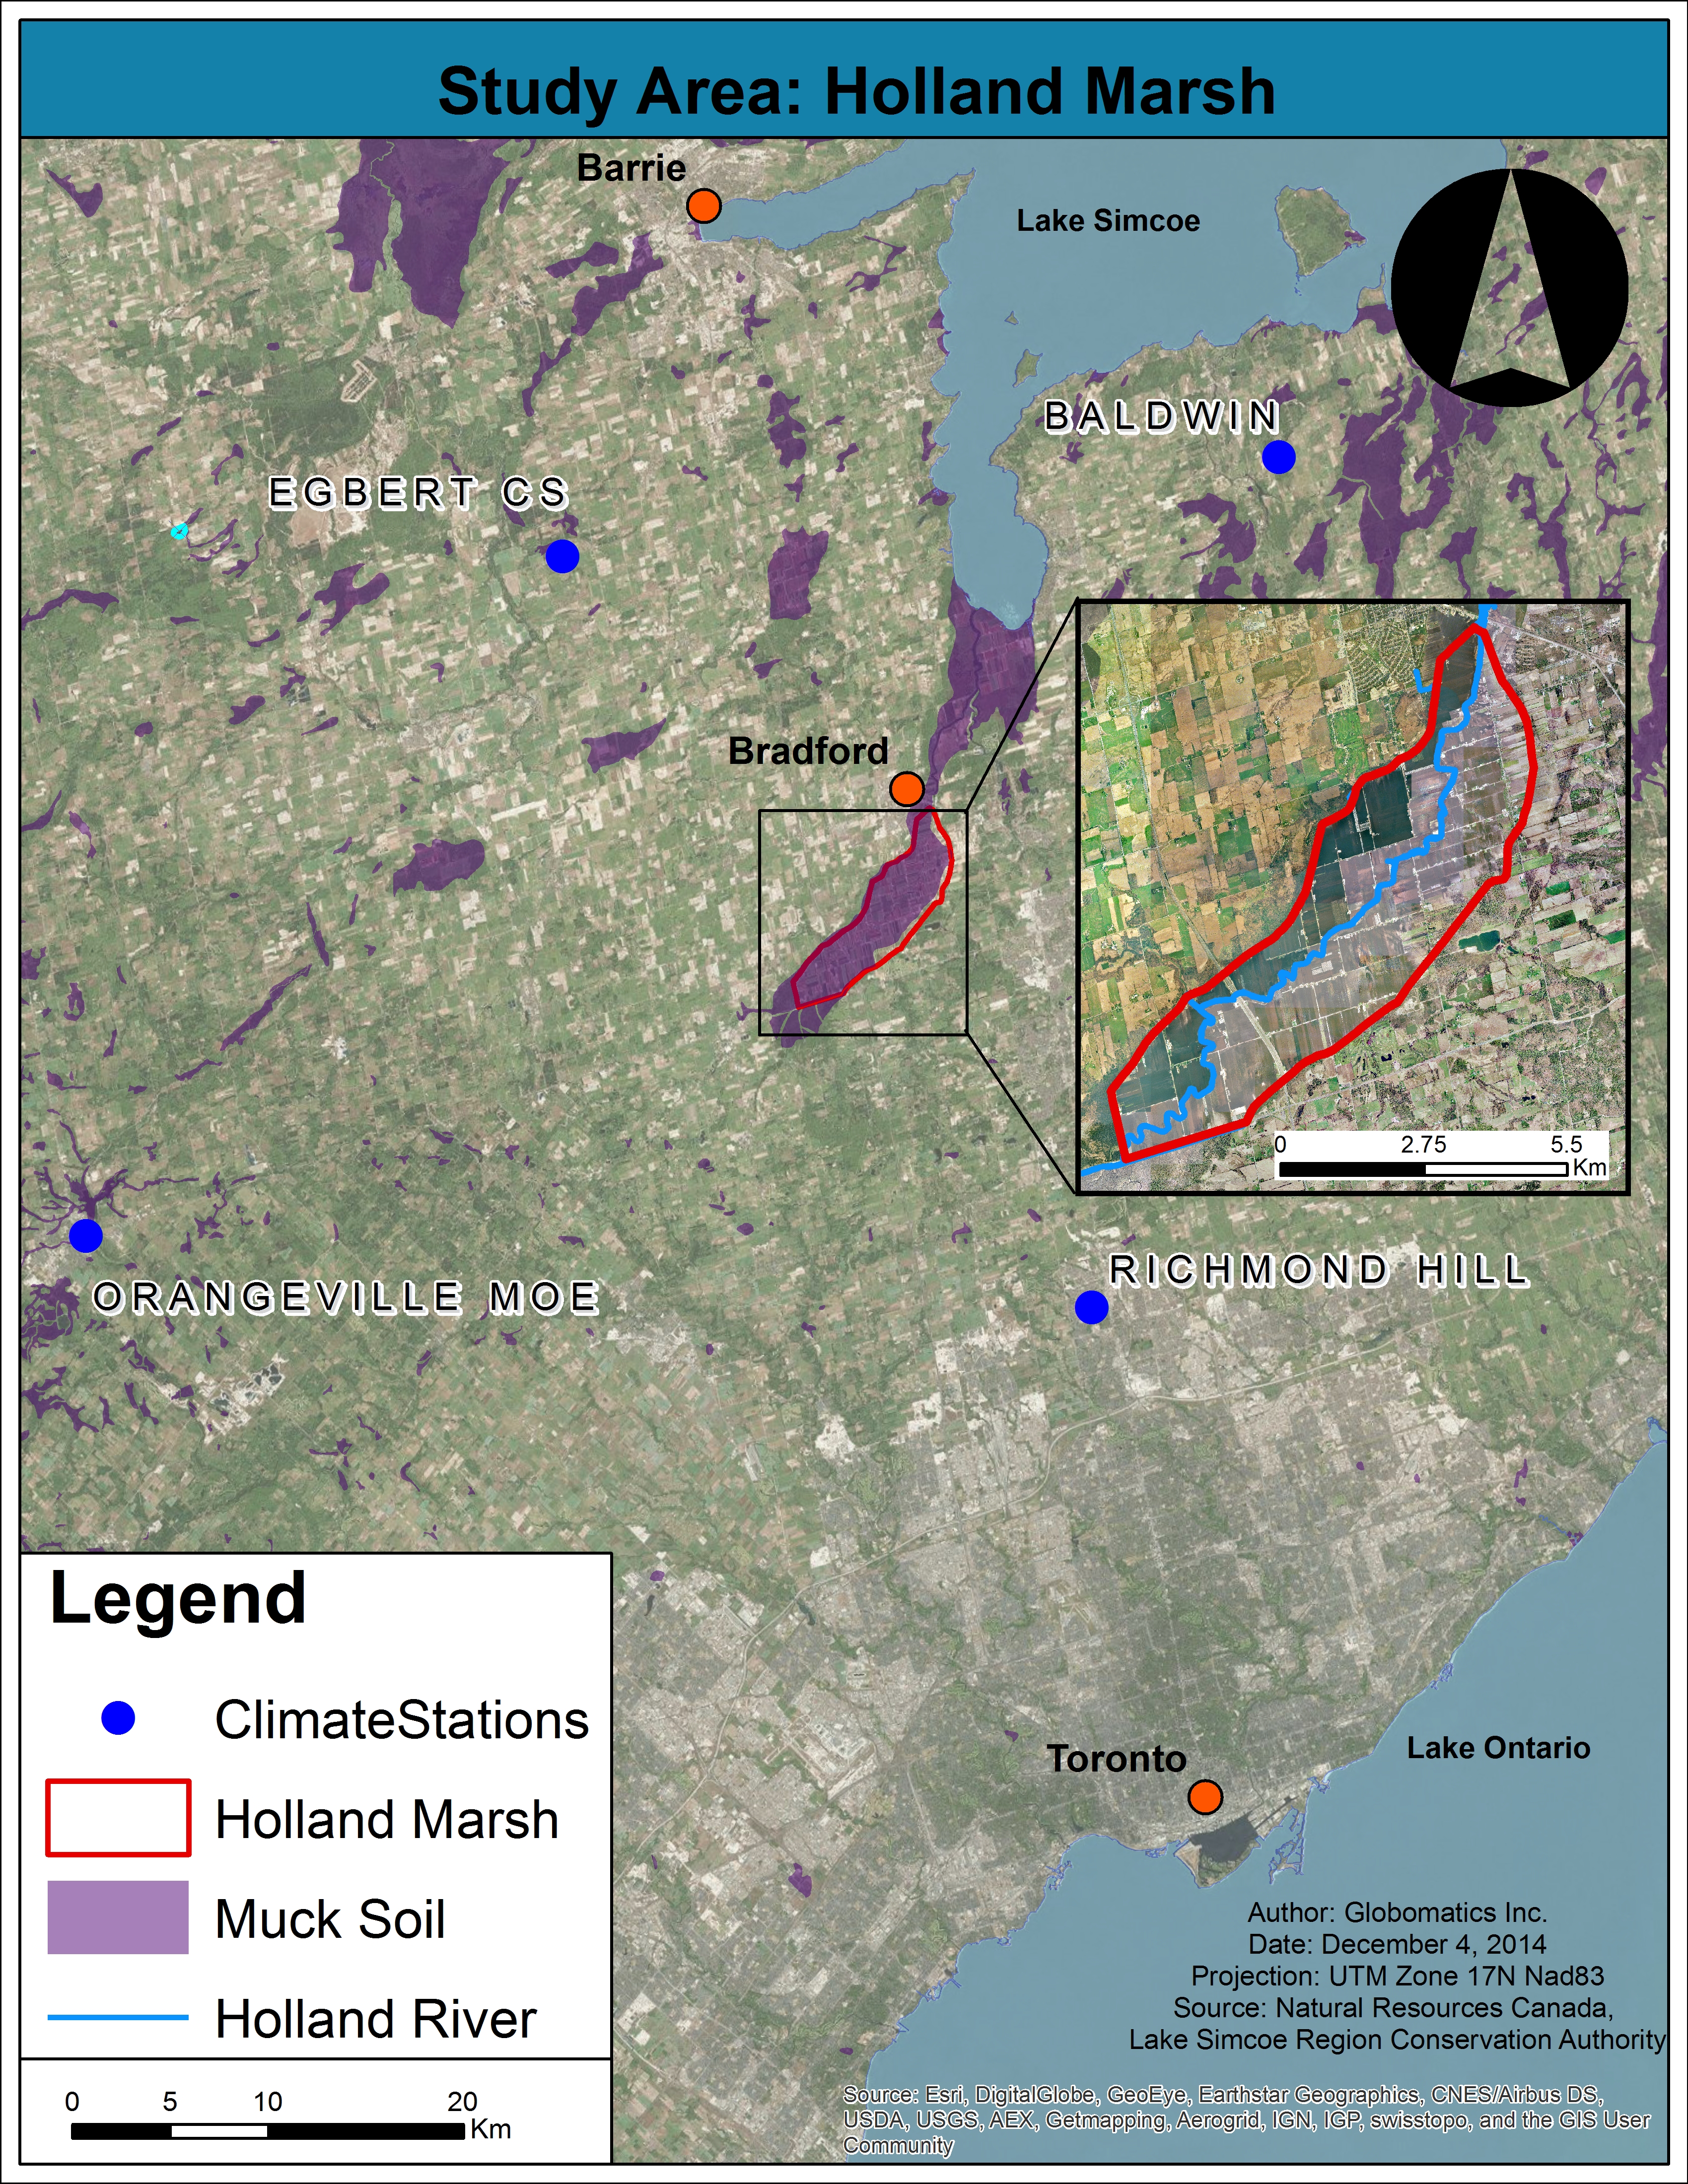
Study Area
The location of the study area is the very fertile Holland Marsh. Located in Bradford, Ontario, the Holland Marsh is located 50 kilometers north of Toronto. The ability to grow and harvest one billion dollars in product each year, is a result of the incredibly fertile muck soil.
Project Goal
The project goal is to derive and calculate the water balance of the Holland Marsh to allow for the identification of areas that are potentially susceptible to high nutrient intake. This will be done by initiating an analysis of meteorological data in the Holland Marsh area. By investigating past climatic trends such as temperature, precipitation, solar radiation and major storm events, the water balance will be calculated on a seasonal basis to highlight areas vulnerable to nutrient loading.
A water balance is the amount of water entering a system compared to that of the water that is leaving the system within time (t). For this particular calculation, the water balance was defined by:
(1) 𝐶𝑊𝐵 = 𝑃−𝑃𝐸𝑇
(2) 𝑃𝐸𝑇 = 0.4 𝑡 𝐼 + 50 𝑡+15
Where:
CWB = Climatic water balance [mm]
P = Monthly precipitation totals [mm]
t = Monthly average temperature [°C]
I = Monthly sum of total solar radiation [cal cm-2 day-1]
|
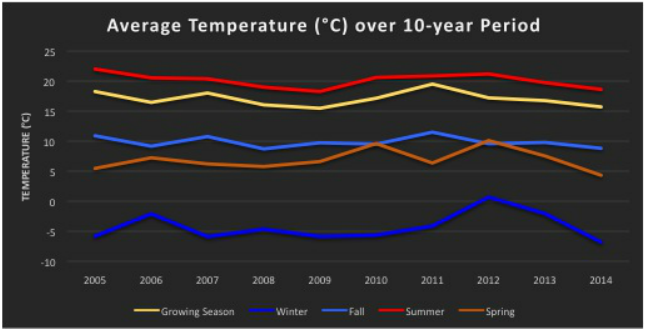
Temperature
Temperatures separated by seasons; Growing Season (July-October), Winter (December-February), Fall (September-November), Summer (June-August), and Spring (March-May). Over the past decade. the winter and spring temperatures have a gradual increasing trend, while the summer and fall months have been gradually decreasing temperatures. Thus resulting in a longer, more moderate growing season. |
|
Precipitation
The daily precipitation events were recorded for the past decade, alongside the 10, 25 and 50 year return events. Significant extremes were shown for August 19, 2005 and July 27, 2014. The precipitation event during August of 2005, was the second largest recorded event since 1954’s Hurricane Hazel (Toronto Sun, 2009). Both of these extreme events produced mass flooding for the Holland Marsh, and most of Southern Ontario. |

|
Methodology
Data Collection
Data collection for this project consisted of data provided by the client (DIG), as well as data obtained by Globomatics Inc. through Environment Canada and the University of Toronto. The three required datasets needed were temperature, precipitation, and solar radiation. Environment Canada has multiple weather stations throughout Ontario, however there are zero located within the Holland Marsh. Duet o lack of stations within the marsh, weather stations located within 50 km were used to statistically calculate and interpolate for the necessary climatic variables.
Four primary stations were selected based on the criteria that they contained daily temperature and precipitation values on a consistent basis. These stations were located in Richmond Hill, Orangeville, Baldwin, and Egbert. Following a quality check of the data sources, it was found that there was some discrepancies within the data (missing values). To account for these discrepancies, a nearby secondary stationwasselectedforeachprimarystationtocompensateandsupplythemissingdata. The secondary stations include Alliston, Udora, Toronto/Buttonville, and the Sandhill Station. Below in Figure 4-2, is a map visualizing the locations of the primary and secondary weather stations.
The solar radiation dataset were obtained through the University of Toronto from 2008 to 2012. The reason for the missing data (2004-2007, 2013-2014) is to maintain data integrity. The station has replaced the sensors during 2007 and 2012. Averages calculated from 2008-2012 years were used as the values during the years with missing data to keep the source consistent. The datasets which were acquired are summarized in Table 1, along with the collection details and sources.
Geodatabase Creation
This stage consisted of creating a geodatabase to contain the collected data. Thisallowedthedatatobe easily accessible, and organized, making it more efficient for the future stages.
The daily climatic data obtained from Environment Canada and the University of Toronto were first organized and compiled into a Microsoft Access database, allowing for easy manipulation of daily data, and transforming it into monthly averages and sums. This data was then imported into a geodatabase within ArcGIS for further processing.
Data Processing
The data processing stage consisted of implementing the methodology outlined in the previous progress report. This was carried out through a set of models generated in ArcGIS’s Model Builder (ESRI, 2015).
The first steps of the processing included statistical interpolation of the climatic variables. Interpolation involves the prediction of values at unmeasured locations (ESRI, 2013). The following interpolation of each variable was done using the methods derived from Wypych (Wypych, 2012):
Findings
For full findings, please refer to Final Report: Section 5.
Data Collection
Data collection for this project consisted of data provided by the client (DIG), as well as data obtained by Globomatics Inc. through Environment Canada and the University of Toronto. The three required datasets needed were temperature, precipitation, and solar radiation. Environment Canada has multiple weather stations throughout Ontario, however there are zero located within the Holland Marsh. Duet o lack of stations within the marsh, weather stations located within 50 km were used to statistically calculate and interpolate for the necessary climatic variables.
Four primary stations were selected based on the criteria that they contained daily temperature and precipitation values on a consistent basis. These stations were located in Richmond Hill, Orangeville, Baldwin, and Egbert. Following a quality check of the data sources, it was found that there was some discrepancies within the data (missing values). To account for these discrepancies, a nearby secondary stationwasselectedforeachprimarystationtocompensateandsupplythemissingdata. The secondary stations include Alliston, Udora, Toronto/Buttonville, and the Sandhill Station. Below in Figure 4-2, is a map visualizing the locations of the primary and secondary weather stations.
The solar radiation dataset were obtained through the University of Toronto from 2008 to 2012. The reason for the missing data (2004-2007, 2013-2014) is to maintain data integrity. The station has replaced the sensors during 2007 and 2012. Averages calculated from 2008-2012 years were used as the values during the years with missing data to keep the source consistent. The datasets which were acquired are summarized in Table 1, along with the collection details and sources.
Geodatabase Creation
This stage consisted of creating a geodatabase to contain the collected data. Thisallowedthedatatobe easily accessible, and organized, making it more efficient for the future stages.
The daily climatic data obtained from Environment Canada and the University of Toronto were first organized and compiled into a Microsoft Access database, allowing for easy manipulation of daily data, and transforming it into monthly averages and sums. This data was then imported into a geodatabase within ArcGIS for further processing.
Data Processing
The data processing stage consisted of implementing the methodology outlined in the previous progress report. This was carried out through a set of models generated in ArcGIS’s Model Builder (ESRI, 2015).
The first steps of the processing included statistical interpolation of the climatic variables. Interpolation involves the prediction of values at unmeasured locations (ESRI, 2013). The following interpolation of each variable was done using the methods derived from Wypych (Wypych, 2012):
- Temperature: interpolated by Residual Kriging,
- Solar radiation: interpolated by ArcGIS’s Solar Analyst (ESRI, 2015),
- Precipitation: interpolated by Ordinary Kriging, and
- Water Balance: calculated using Map Algebra.
Findings
For full findings, please refer to Final Report: Section 5.
Bibliography
Planscape Inc. . (2009). Holland Marsh Agricultural Impact Study. Green Belt .
Planscape Inc. . (2009). Holland Marsh Agricultural Impact Study. Green Belt .
