A comparative analysis using change detection to monitor urban growth and its influences on public transportation in St. Catharines & Thorold, Ontario
[2000-2013]
This research project looks into the change of the land-use/land cover within the City of St. Catharines and Thorold from 2000-2013. Addressing the recent urban developments, our team determined if the St. Catharines public transit system currently operates in an efficient manner, meeting the needs of potential transit users across both cities. The SCTC is a shared service by both local residents and members of the Brock University community. With thousands of people relying on public transit as their primary means of mobility through both cities, an analysis between urban growth and public transportation networks was undertaken.
Click here for the full document.
Click here for the full document.
Study Area
The area of interest includes the City of St. Catharines along with a portion of its neighbour to the south, the City of Thorold (Figure 1). The study area resides within the Niagara Region, just south of Lake Ontario, and 19 km from the U.S.A border. The area consists of a total study area of 137.484 km2 while the ground area is 97.221 km2 leaving 40.263 km2 of the study area to water bodies. Although the study area does not cover all of the two neighbouring cities, these cities have a combined population of 149,331 in 2011, down from 150,213 in 2006, with a low in 2001 of 144,215
Data Processing
Image Classification
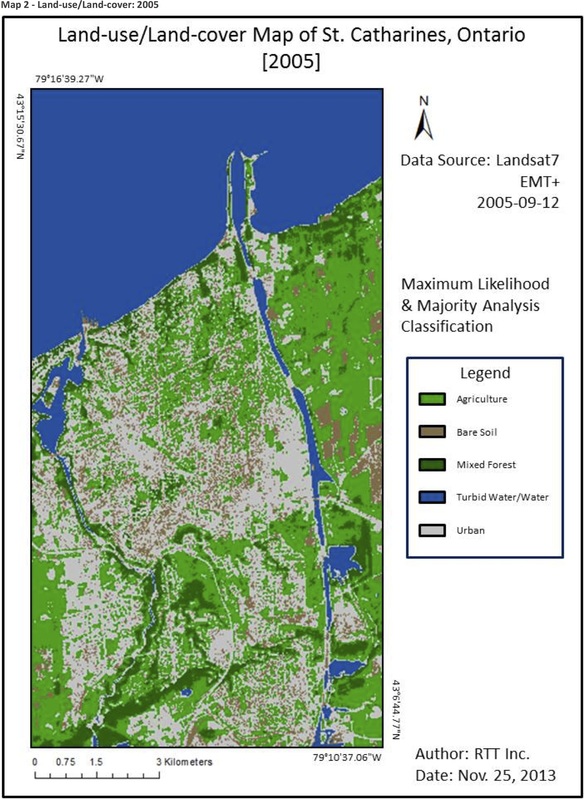
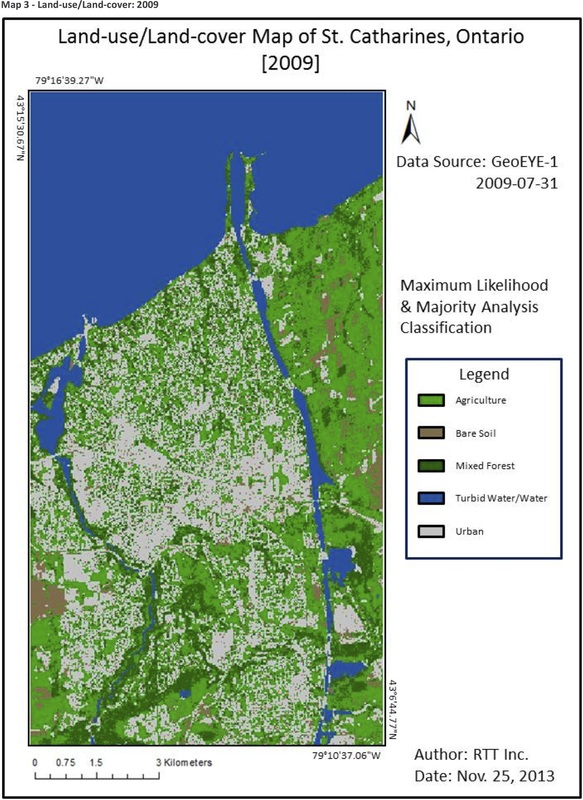
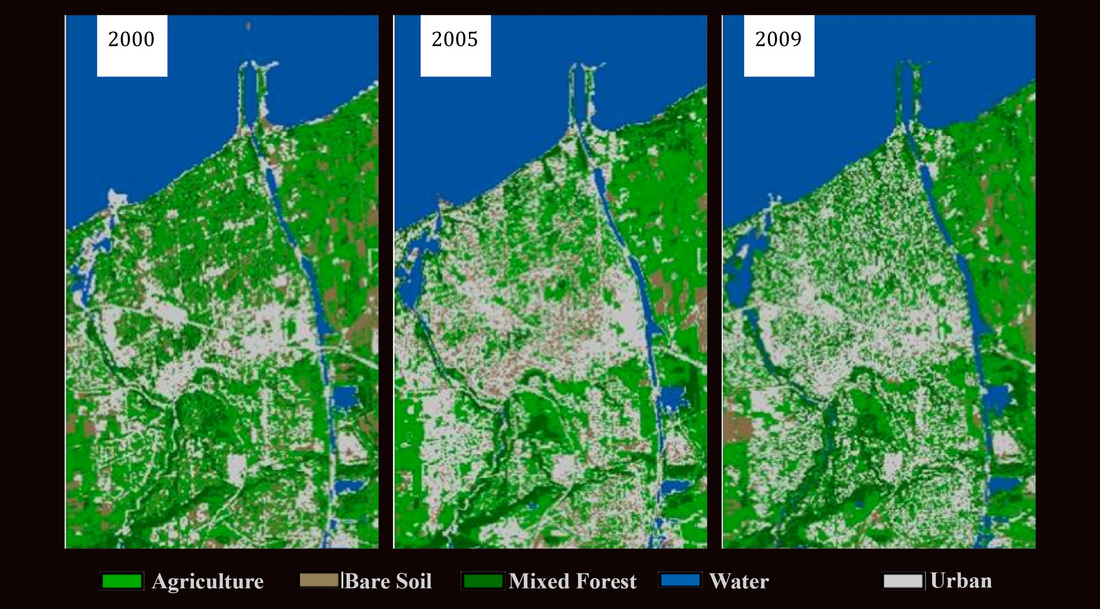
Three Landsat remotely sensed images (2000, 2005, and 2009) were classified based on Land-use/Land cover (LULC) using the maximum-likelihood algorithm from user defined ROI's (Region of Interests). This classified each image on a pixel by pixel basis, defining each pixel as one of 6 classes:
Class - Description
The area of interest includes the City of St. Catharines along with a portion of its neighbour to the south, the City of Thorold (Figure 1). The study area resides within the Niagara Region, just south of Lake Ontario, and 19 km from the U.S.A border. The area consists of a total study area of 137.484 km2 while the ground area is 97.221 km2 leaving 40.263 km2 of the study area to water bodies. Although the study area does not cover all of the two neighbouring cities, these cities have a combined population of 149,331 in 2011, down from 150,213 in 2006, with a low in 2001 of 144,215
Data Processing
Image Classification
Three Landsat remotely sensed images (2000, 2005, and 2009) were classified based on Land-use/Land cover (LULC) using the maximum-likelihood algorithm from user defined ROI's (Region of Interests). This classified each image on a pixel by pixel basis, defining each pixel as one of 6 classes:
Class - Description
- Agriculture - Any type of crop, grassland, that is outside that of forest.
- Bare Soil - Any land-cover that is not covered by any type of agriculture or urban setting. Includes gravel pits, aggregated fields, and dirt roads.
- Mixed Forest - Land-cover consisting of large trees; coniferous and deciduous.
- Turbid Water - Water consisting of minimal depths, can contain turbid soils.
- Urban - Developed land, from commercial buildings, to roads and residential areas.
- Water - Water that contains great depths, such as large lakes.
Bus Route Overlay
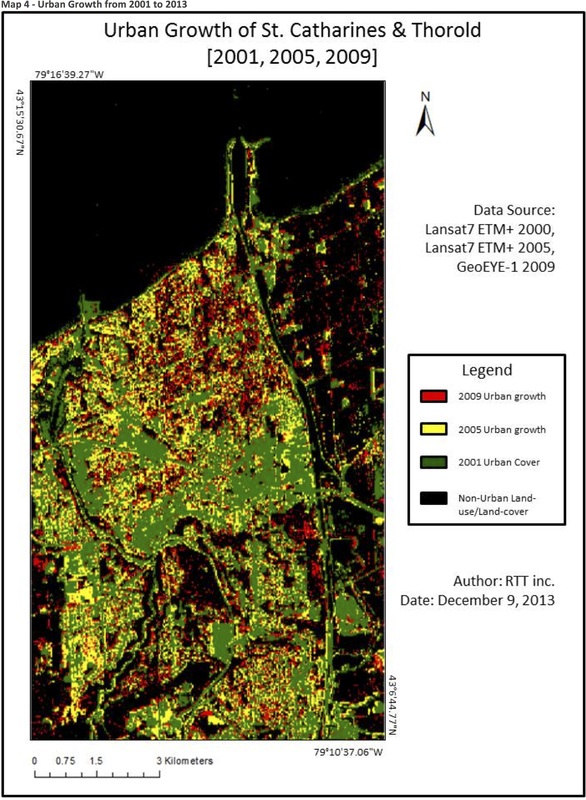
Bus routes for the corresponding years were then overlaid on top of the classified images, and analyzed where the trends in urban growth and new bus routes were compared.
Methodology
In the both the cities of St. Catharines and Thorold, Ontario, urban development has been affected by transportation infrastructure. This relationship was investigated by first monitoring the change of urban pixels in all three images (2000, 2005, and 2009), and second, then overlaying the St. Catharines Transit Commission’s bus routes from 2000 – 2013 atop the three images, allowing for statistical and visual analyses to be conducted. This section will analyze the land-use/land-cover types of each image, the changed results and lastly, commentary in regards to the public transit routes and their impact on urban development.