Toronto Condo Rental Price
Toronto is Canada's largest city with a population of 2.7 million in 2016 up from 2.6 million in 2011. As the fourth largest city in North America, how does the housing market look? This study looks at 3,400 condo listings collected from December 2016 to February 2017 containing attributes such as square feet, number of beds, number of baths, available parking and lockers, distance to Lake Ontario, distance to downtown (Union Station), neighbourhood demographics, and the distance to parks and schools. We will look at prices based on individual listings but also as groups for the 140 neighbourhoods in Toronto. The goal here is to find which neighbourhoods are the most expensive and determine what factors play into driving these prices.
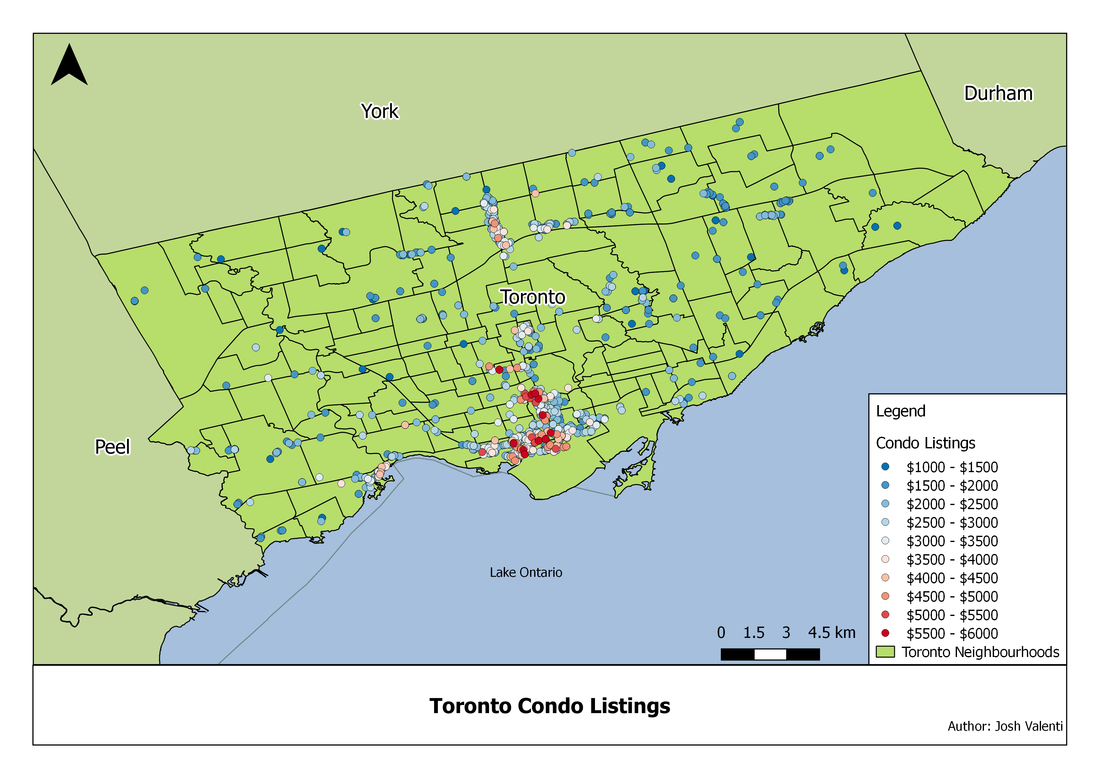
Table 1 - Monthly Rent Prices
| Beds | Square Feet | |||||||||||||||
|---|---|---|---|---|---|---|---|---|---|---|---|---|---|---|---|---|
| 0-499 | 500-599 | 500-699 | 600-699 | 700-799 | 700-899 | 800-899 | 900-999 | 1000-1199 | 1200-1399 | 1400-1599 | 1600-1799 | 1800-1999 | 2000-2249 | 2250-2499 | 2500-2749 | |
| Studio | $1,570.79 | $1,781.25 | NaN | NaN | NaN | NaN | NaN | NaN | $2,125.00 | NaN | NaN | NaN | NaN | NaN | $3,950.00 | NaN |
| Studio & 1 | $1,437.50 | $1,599.67 | NaN | NaN | NaN | NaN | NaN | NaN | NaN | NaN | NaN | NaN | NaN | NaN | NaN | NaN |
| 1 | $1,703.70 | $1,796.45 | $1,650.00 | $1,884.70 | $2,097.50 | NaN | $2,863.96 | $2,855.00 | $2,778.80 | $3,200.00 | $3,000.00 | NaN | NaN | NaN | NaN | NaN |
| 1+1 | $1,500.00 | $1,860.57 | NaN | $1,923.39 | $2,193.25 | $2,200.00 | $2,263.14 | $2,407.07 | $3,072.25 | $4,933.33 | NaN | NaN | NaN | NaN | NaN | NaN |
| 2 | NaN | $2,021.88 | NaN | $2,218.09 | $2,414.00 | NaN | $2,458.16 | $2,509.33 | $2,871.90 | $3,527.97 | $3,930.56 | $4,490.00 | $6,000.00 | NaN | NaN | NaN |
| 2+1 | NaN | $2,150.00 | NaN | $2,345.00 | $2,488.08 | NaN | $2,581.13 | $2,739.32 | $2,965.18 | $3,148.79 | $3,507.59 | $4,600.00 | $3,150.00 | NaN | $4,500.00 | $5,900.00 |
| 3 | NaN | NaN | NaN | $2,850.00 | $2,700.00 | NaN | $2,908.75 | $2,927.67 | $2,804.19 | $2,470.74 | $3,271.67 | $3,980.00 | $3,546.00 | $4,063.33 | $3,220.00 | $4,666.67 |
| 3+1 | NaN | NaN | NaN | NaN | NaN | NaN | NaN | $3,350.00 | $3,812.25 | $3,300.00 | $3,377.14 | $3,745.00 | $2,990.00 | $6,000.00 | $4,000.00 | $6,000.00 |
| 4 | NaN | NaN | NaN | NaN | NaN | NaN | NaN | NaN | NaN | NaN | NaN | NaN | $3,100.00 | NaN | NaN | NaN |
| 4+1 | NaN | NaN | NaN | NaN | NaN | NaN | NaN | NaN | NaN | $2,450.00 | NaN | NaN | NaN | NaN | NaN | NaN |


Average Price By Neighbourhood

Highest Price Neighbourhoods:
Lowest Price Neighbourhoods:
|

Highest Price Neighbourhoods:
Lowest Price Neighbourhoods:
|
For both the average rental price by neighbourhood for both 1 bedroom and 2 bedrooms in the City of Toronto, the higher price units are the ones located in the central part of the city (the downtown core). These prices are on average $800-$1,000 greater than those condo's located to the east, and west city limits. A second cluster of prices occur, located to the north of the downtown core. These are valued to be only a few hundred of dollars cheaper per month.
Mean Difference By Beds, SqFt for Neighbourhoods
To compare all the listings together, the listings were grouped by both the Square Feet and Number of beds as those variables distinguish one from another. These groups then allowed us the ability to compare all the listings as if they were one type, using the difference from the mean of each grouped mean (ex: a listing a 1 Bed, 1 Bath and SqFt between 500-600 with a monthly rental cost of $1,500.00 had a mean difference of -$296.45 [mean for this type is $1,796.45 as shown in table 1]). The results are shown below for all 3400 listings.
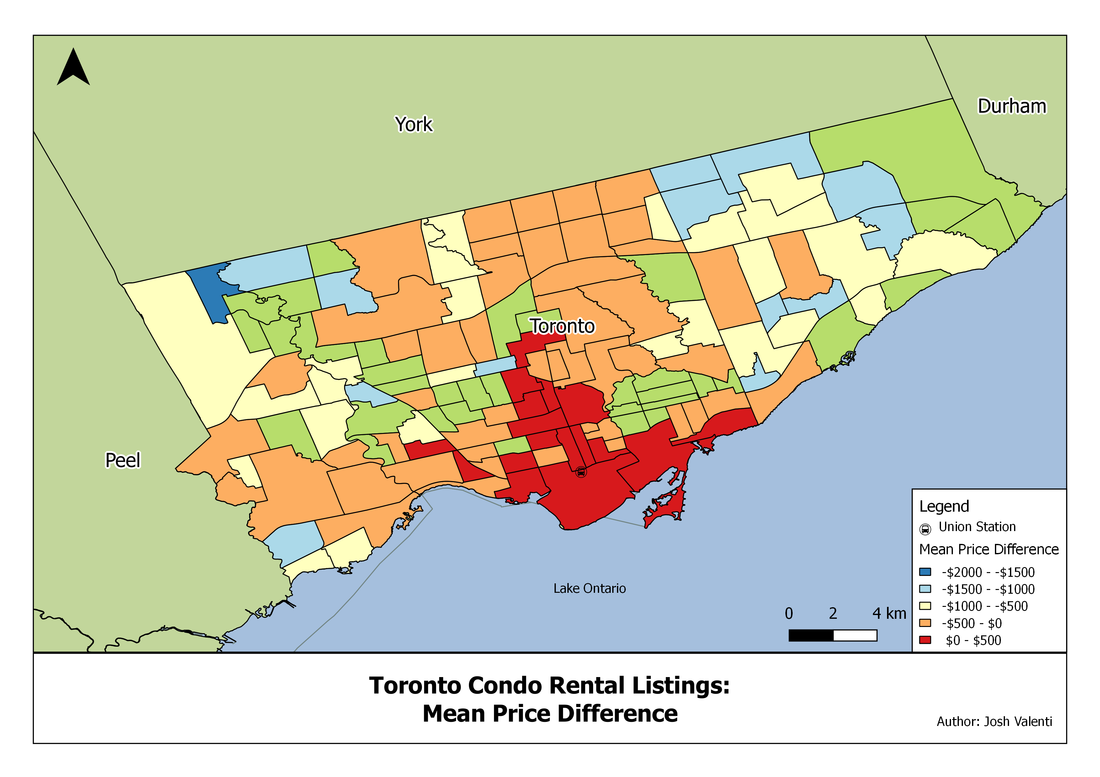
As show above, the areas of higher rent for all condo sizes seems to be greatest (the only values above the average) around central downtown. The clustering of the condo prices just below the average ($500 less than the average) were displayed in a unique way and when overlaying with subway stations that seems to be the same pattern.
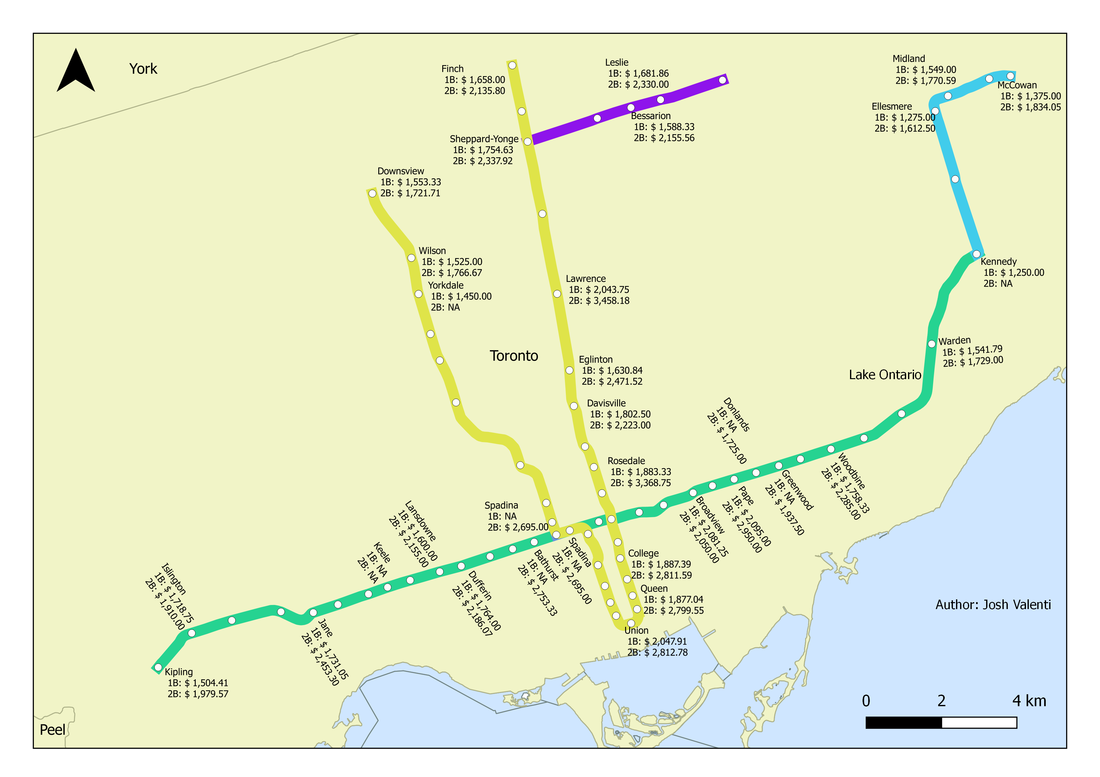
Average Grouped Price by Closest Subway Station
It was noticed that the spatial distribution of rental condo's was very similar to that of Toronto's subway stations as shown below. This clustering was than analyzed, grouping the rental postings to that of it's nearest Subway station. These results seems to have the greatest impact on rental prices as stations located closest to downtown have experienced the greatest mean difference.

Distance to Subway Station |
Number of Listings |
Percentage |
<500m |
1666 |
49% |
<1,000m |
2208 |
65% |
<1,500m |
2526 |
74% |
<2,000m |
2765 |
81% |
<5,000m |
2975 |
87% |
|
Highest 3 Average Rental Prices by Nearest Subway Station
|
Lowest 3 Rental Prices by Nearest Subway Station
|
Parking and Lockers
Another factor that plays into the price of the monthly rent is the availability to lockers and parking. Parking costs in the city of Toronto, cost anywhere from $200-$500 depending on the location, however condo's that have offer a parking space are on average $300 higher than those that don't offer a spot, monthly. The same thing for lockers. The average price for a condo to come equipped with an available locker is on average $100 higher than one that does not offer lockers.
|
|
Influence of Demographics by neighbourhood on Rental Price

Influence of Crimes by neighbourhood on Rental Price

Influence of Location on Rental Price


Results
The most influential variables on rental prices are not that of drug charges or demographics. The most influential factor on rental prices in Toronto is the location. The location to the City's subway stations to be exact. As shown above the distance to Union Station (or the downtown core) plays a roll into influencing the price. As you move further away from both the water front and the downtown core, prices seem to drop. The distance to a subway doesn't play a large factor, but rather which subway station is located closest with the obvious downtown stations having higher than average prices. This is shown below.
|
Highest 3 Stops for 1B:
|
Highest 3 Stops for 2B:
|
Disclaimer: All the data derived here is open source and can be found on the City of Toronto's Website, Statistics Canada or a variety of rental listing web sites. This analysis was completed using all open software (QGIS, and python).
