911 Call Data Analysis
This analysis began with over 2000 calls documented with latitude and longitude for Beaverton, Oregon. With the 911 calls displayed on a map it was easy to visualize areas of higher call volumes (the downtown core) to that of lower call volumes (rural areas). Beyond this extent this analysis dives into figuring out what variables play a factor into the number of 911 calls to actively predict future call patterns so municipalities/emergency units can plan accordingly. This was done in three steps:
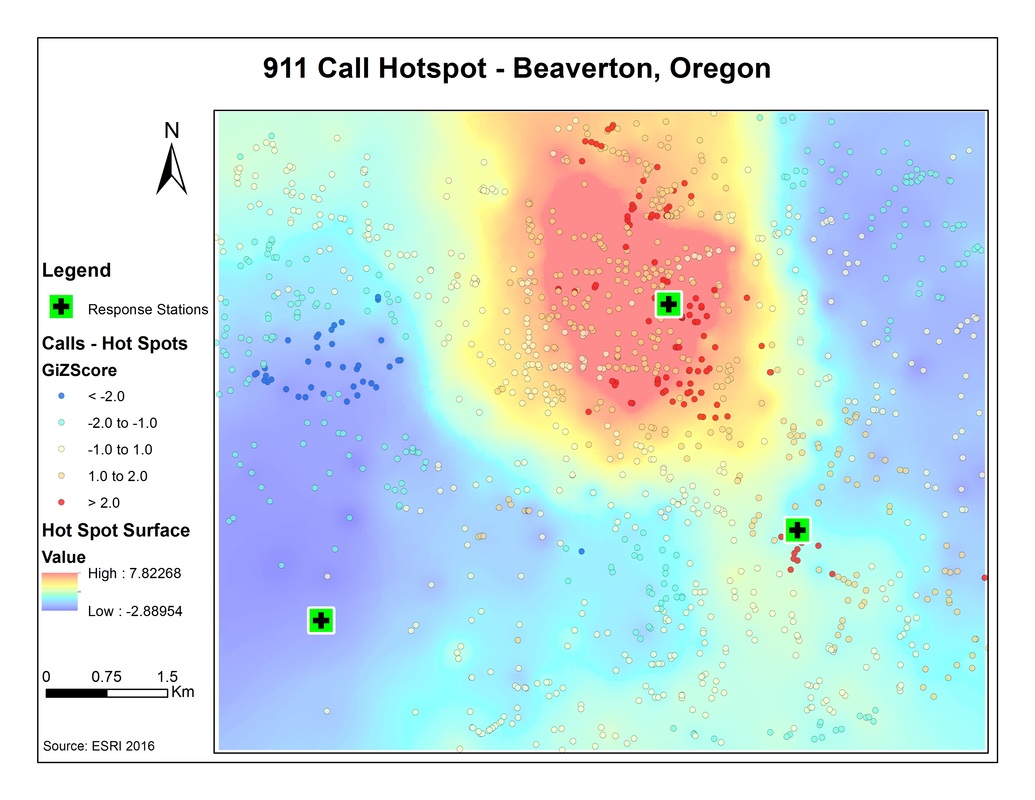
Step 1: Hot spot Analysis
The map produced below displays a hot spot analysis of the study area, displaying a hot spot located in the top/centre of the map centralizing around the downtown core. There is an emergency response station located is the south west portion of the map located in a cold spot, but to determine if this is optimal planning a statistical analysis is undertaking place in steps 2 and 3.
- Plotting and running a hotspot analysis of the study area to determine areas of high 911 call volume.
- Determining factors that play an active roll in predicting areas of potential hotspots using the Ordinary Least Squares (OLS) statistical method.
- Using the variables in step 2 to actively predict areas of potential high call volumes using the Geographically Weighted Regression (GWR) method.
Step 1: Hot spot Analysis
The map produced below displays a hot spot analysis of the study area, displaying a hot spot located in the top/centre of the map centralizing around the downtown core. There is an emergency response station located is the south west portion of the map located in a cold spot, but to determine if this is optimal planning a statistical analysis is undertaking place in steps 2 and 3.
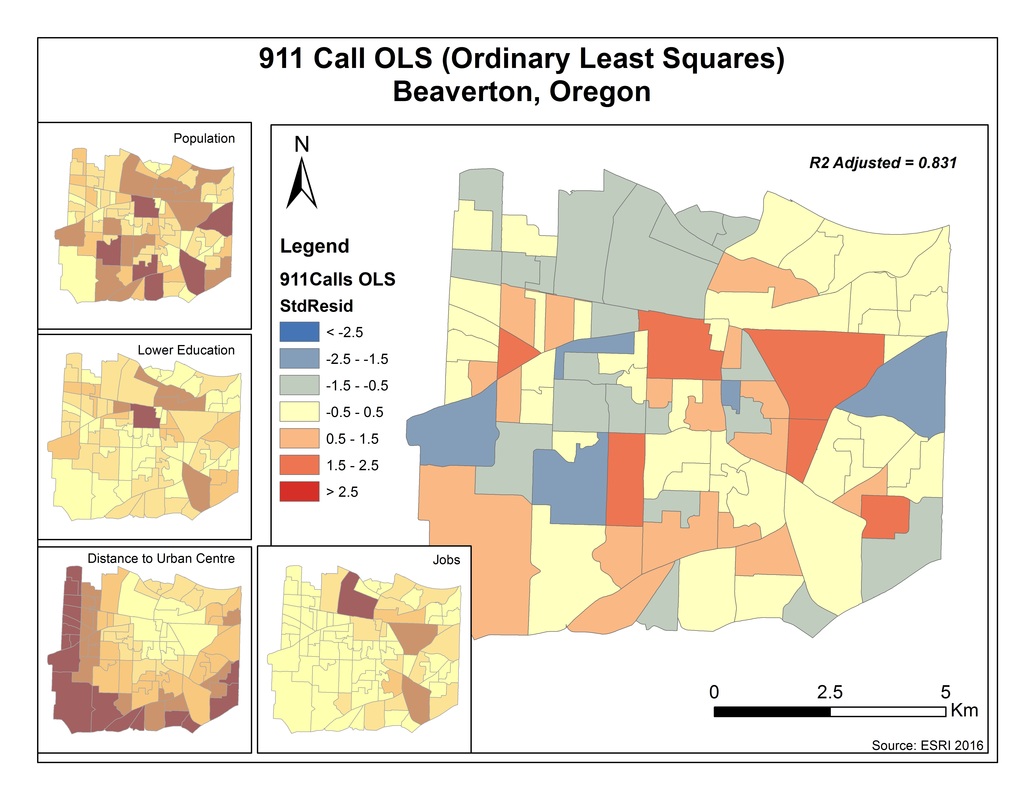
Step 2: Ordinary Least Squares
To determine if the response stations are placed in optimized location, we needed to further understand what is causing the hot spot located at the centre of the study area. Factors that were looked at and found of significant value were: Population, Education Level, Distance to Urban Centre, and Jobs. These variables were then included in OLS analysis providing an significant Adjusted R-Squared value of 0.831. This analysis however also provided a significant Koenker value of 0.003193, which suggest that the variables are significant in some areas but not in others which lead us to continue the analysis using the Geographically Weighted Regression (GWR) in step 3.
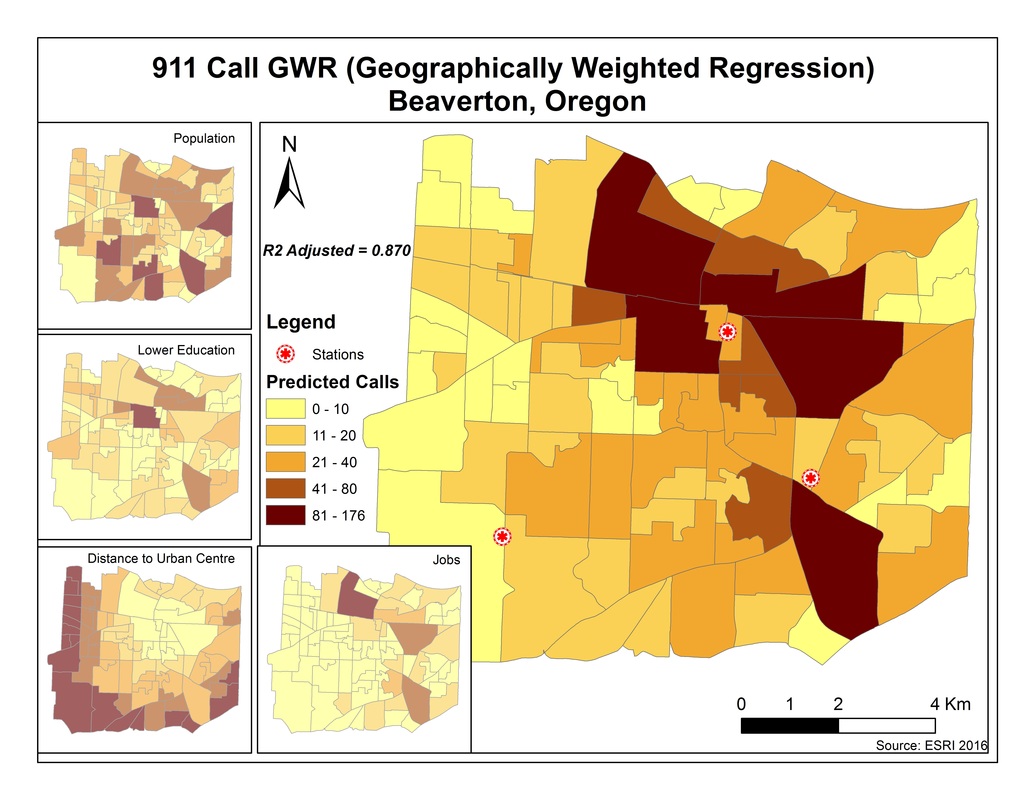
Step 3: Geographically Weighted Regression
This step was used to predict future patterns based on the variables determined in step 2. With these variables inputted into the GWR equation, a more significant Adjusted R-Squared value of 0.870 was produced. With this prediction displayed in the map below, we can determine that the emergency stations are in fact located in the optimal locations based on underlying patterns corresponding to call volumes.